简单示例
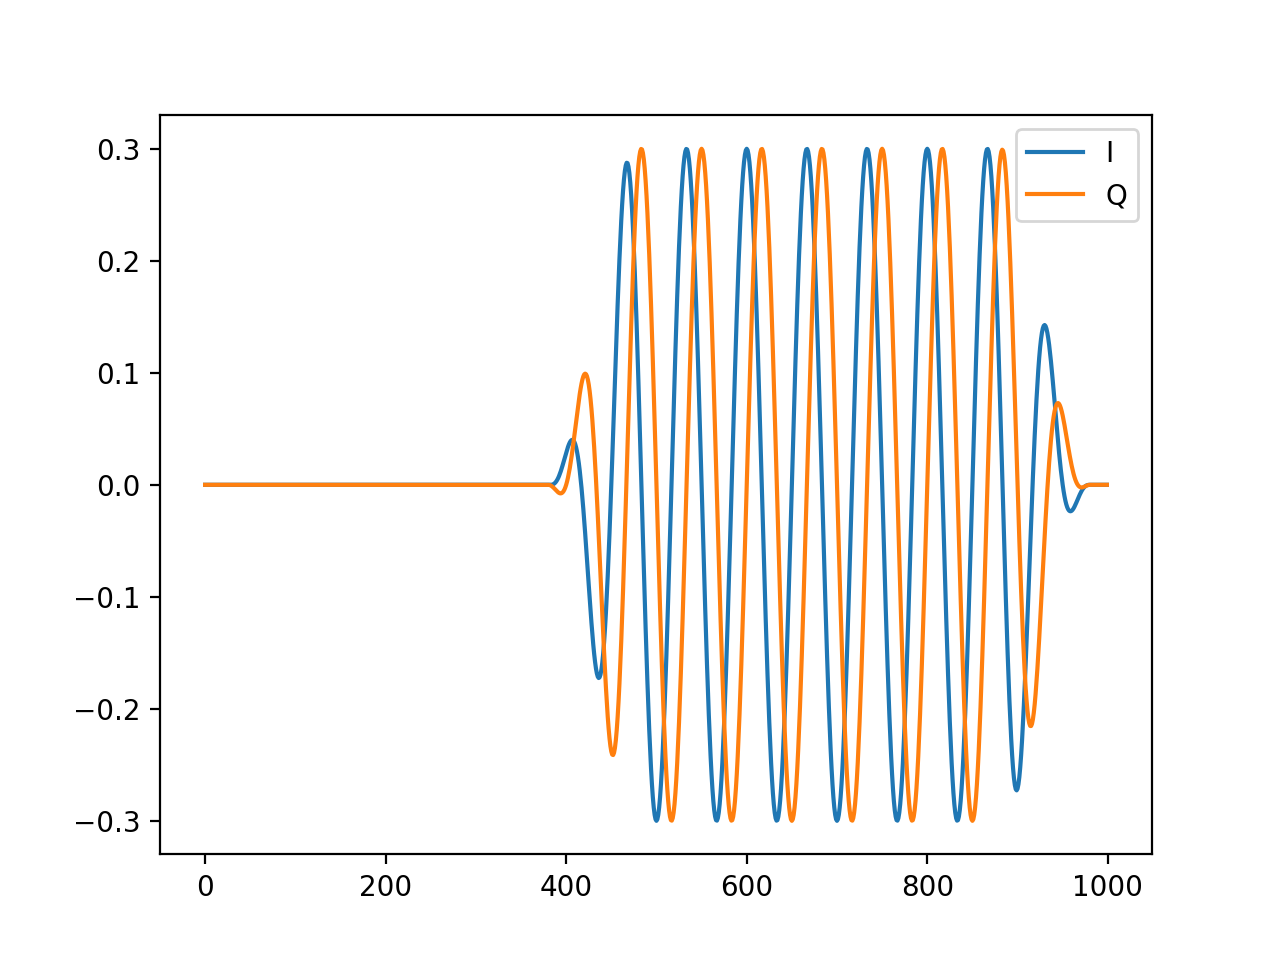
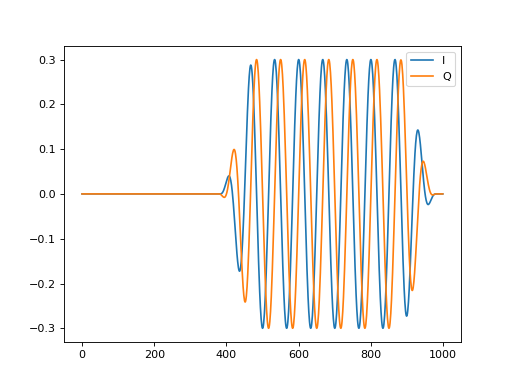
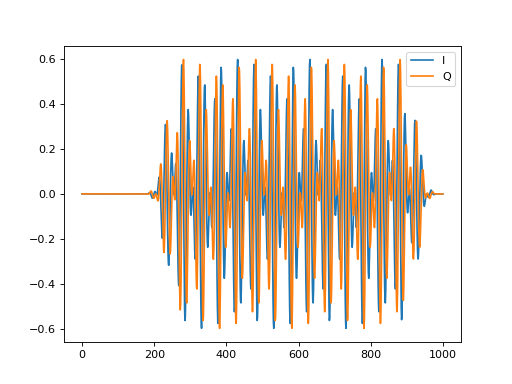
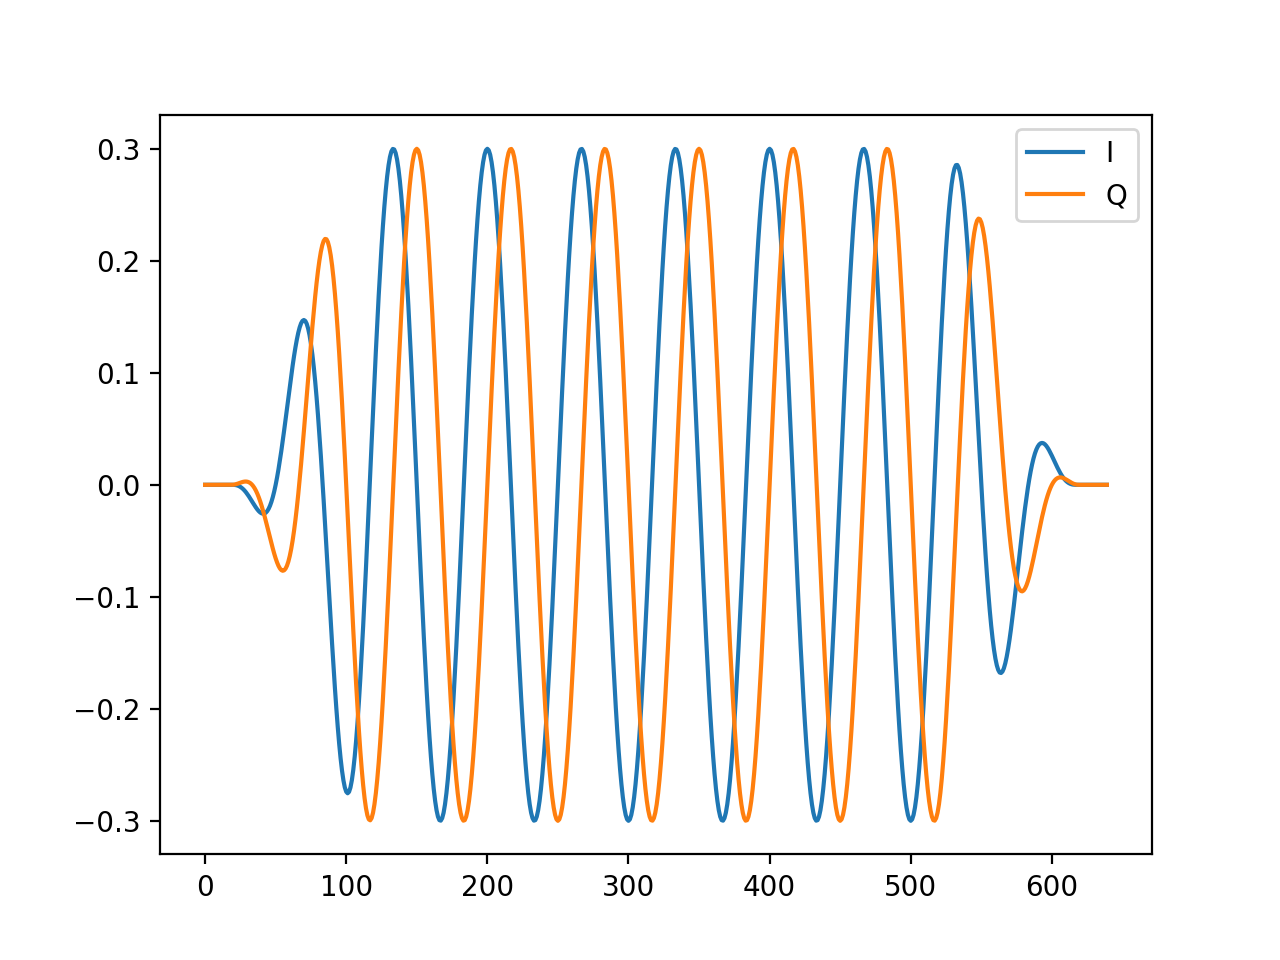
简单的 Hann 脉冲
import matplotlib.pyplot as plt

from bosing import Barrier, Channel, Hann, Play, Stack, generate_waveforms

channels = {"xy": Channel(30e6, 2e9, 1000)}
shapes = {"hann": Hann()}
schedule = Stack(duration=500e-9).with_children(
    Play(
        channel_id="xy",
        shape_id="hann",
        amplitude=0.3,
        width=100e-9,
        plateau=200e-9,
    ),
    Barrier(duration=10e-9),
)
result = generate_waveforms(channels, shapes, schedule)
w = result["xy"]
plt.plot(w[0], label="I")
plt.plot(w[1], label="Q")
plt.legend()
(Source code, png, hires.png, pdf)
插值包络
import matplotlib.pyplot as plt
import numpy as np
from scipy.interpolate import make_interp_spline

from bosing import Barrier, Channel, Interp, Play, Stack, generate_waveforms

channels = {"xy": Channel(0, 2e9, 1000)}
# x should be in the range [-0.5, 0.5]
x = np.linspace(-0.5, 0.5, 20)
y = np.cos(np.pi * x)
interp = make_interp_spline(x, y)
knots = interp.t
controls = interp.c
degree = interp.k
shapes = {"halfcos": Interp(knots, controls, degree)}
schedule = Stack(duration=500e-9).with_children(
    Play(
        channel_id="xy",
        shape_id="halfcos",
        amplitude=0.3,
        width=100e-9,
    ),
    Barrier(duration=10e-9),
)
result = generate_waveforms(channels, shapes, schedule)
w = result["xy"]
plt.plot(w[0], label="I")
plt.plot(w[1], label="Q")
plt.legend()
(Source code, png, hires.png, pdf)

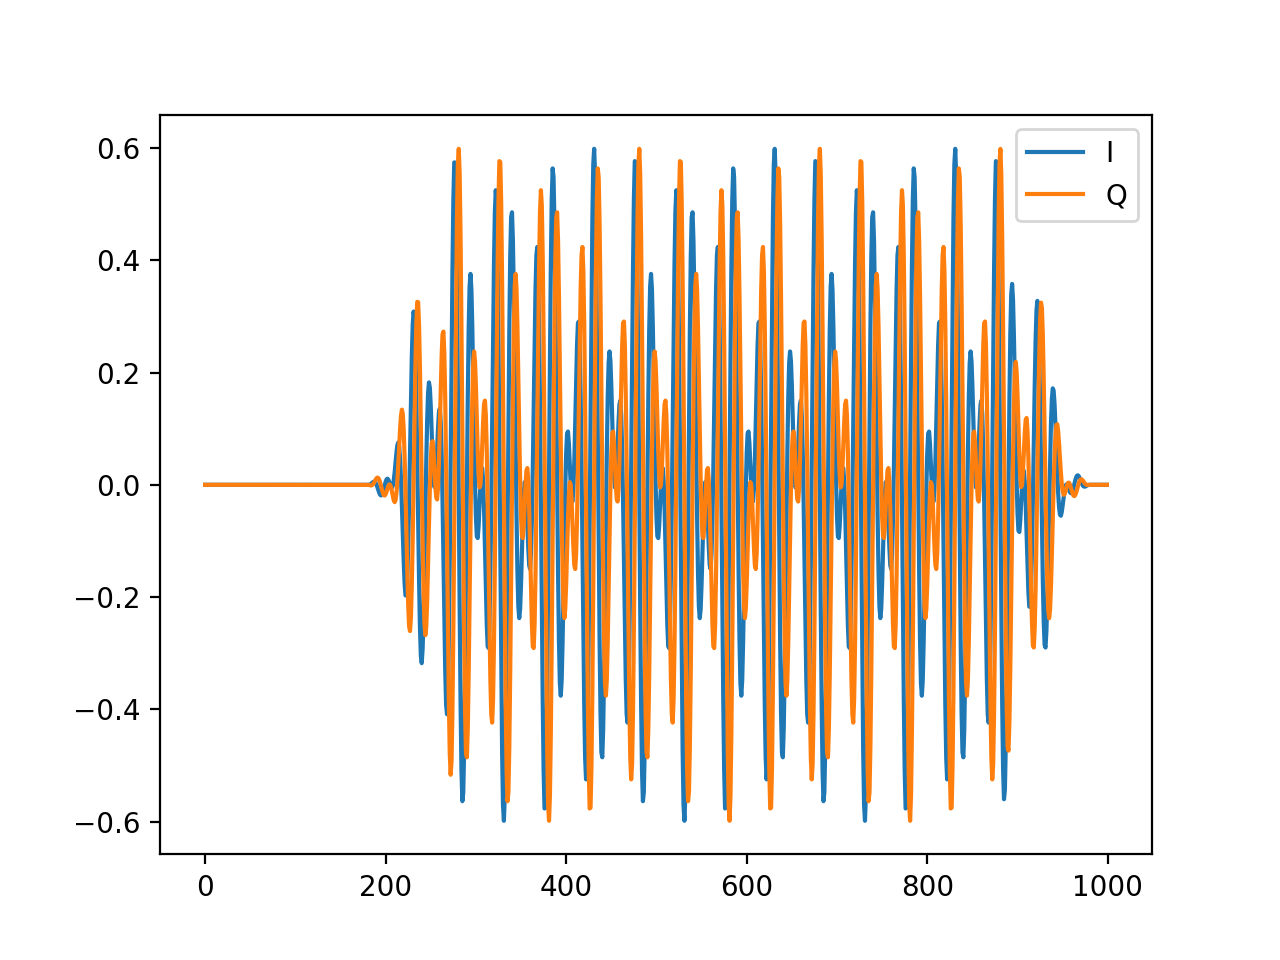
重叠脉冲
import matplotlib.pyplot as plt

from bosing import Absolute, Barrier, Channel, Hann, Play, Stack, generate_waveforms

channels = {"m": Channel(30e6, 2e9, 1000)}
shapes = {"hann": Hann()}
measure = Absolute().with_children(
    *[
        Play(
            channel_id="m",
            shape_id="hann",
            amplitude=0.3,
            width=100e-9,
            plateau=300e-9,
            frequency=40e6 * i + 60e6,
        )
        for i in range(2)
    ]
)
schedule = Stack(duration=500e-9).with_children(
    measure,
    Barrier(duration=10e-9),
)
result = generate_waveforms(channels, shapes, schedule)
w = result["m"]
plt.plot(w[0], label="I")
plt.plot(w[1], label="Q")
plt.legend()
(Source code, png, hires.png, pdf)

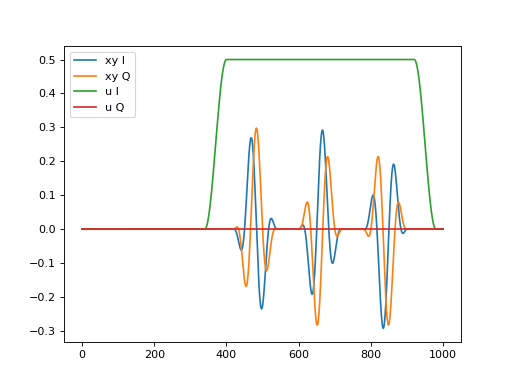
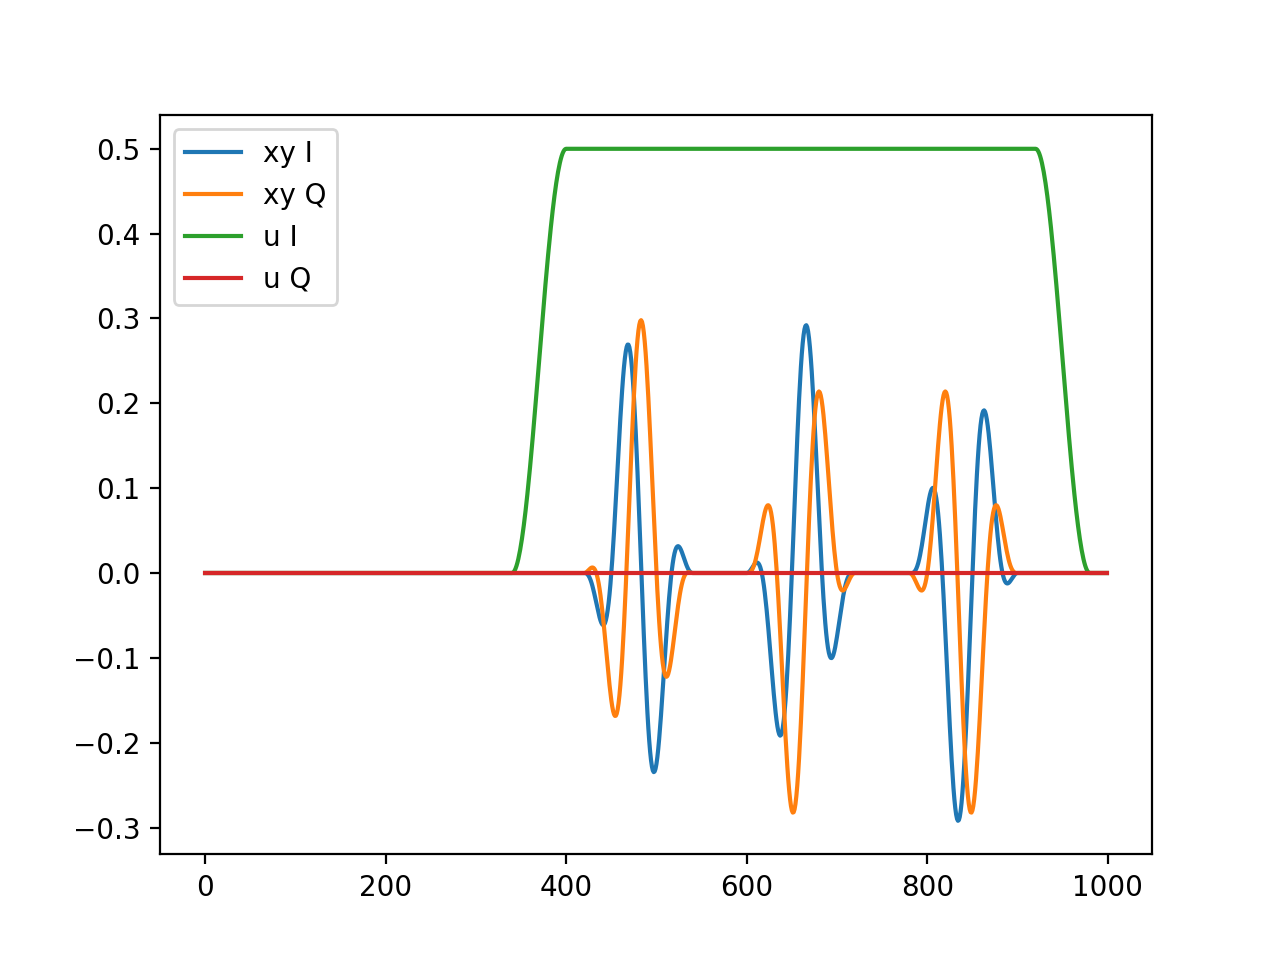
变长脉冲
import matplotlib.pyplot as plt

from bosing import Barrier, Channel, Grid, Hann, Play, Repeat, Stack, generate_waveforms

channels = {
    "xy": Channel(30e6, 2e9, 1000),
    "u": Channel(0, 2e9, 1000),
}
shapes = {
    "hann": Hann(),
}
grid = Grid(columns=[40e-9, "auto", 40e-9]).with_children(
    # flexible u pulse spanning 3 columns
    (
        Play(
            channel_id="u",
            shape_id="hann",
            amplitude=0.5,
            width=60e-9,
            alignment="stretch",
            flexible=True,
        ),
        0,
        3,
    ),
    # xy pulse in the middle column
    (
        Repeat(
            Play(
                channel_id="xy",
                shape_id="hann",
                amplitude=0.3,
                width=60e-9,
            ),
            count=3,
            spacing=30e-9,
        ),
        1,
    ),
)
schedule = Stack(duration=500e-9).with_children(
    grid,
    Barrier(duration=10e-9),
)
result = generate_waveforms(channels, shapes, schedule)
w = result["xy"]
plt.plot(w[0], label="xy I")
plt.plot(w[1], label="xy Q")
w = result["u"]
plt.plot(w[0], label="u I")
plt.plot(w[1], label="u Q")
plt.legend()
(Source code, png, hires.png, pdf)

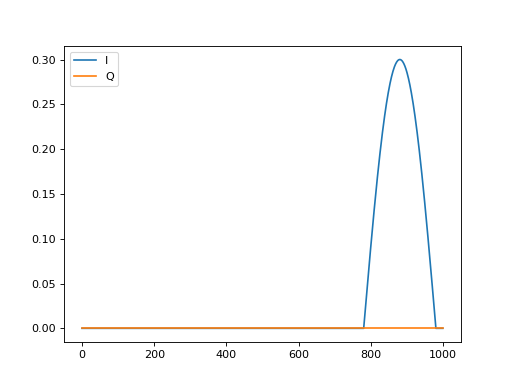
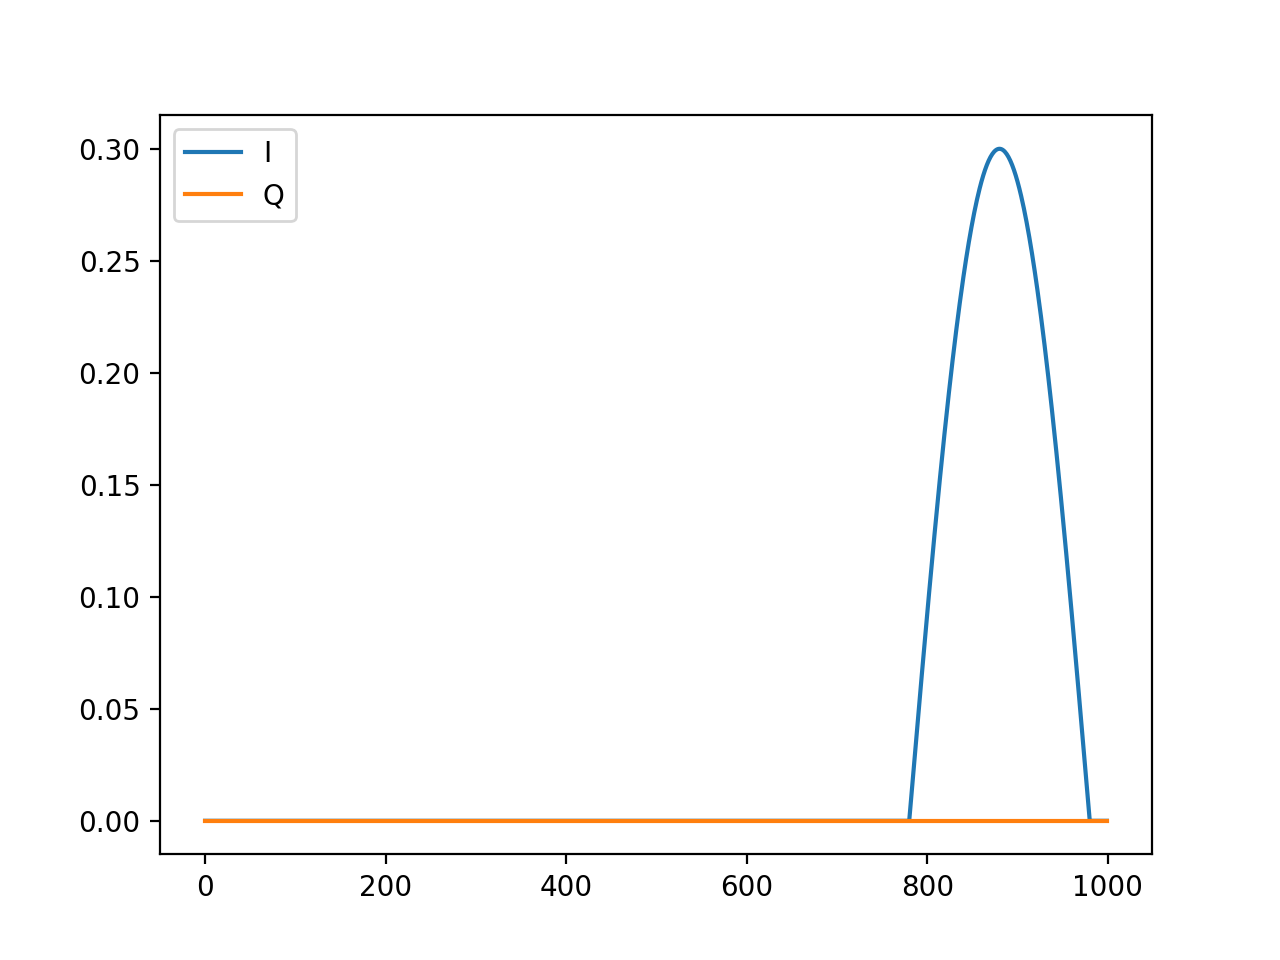
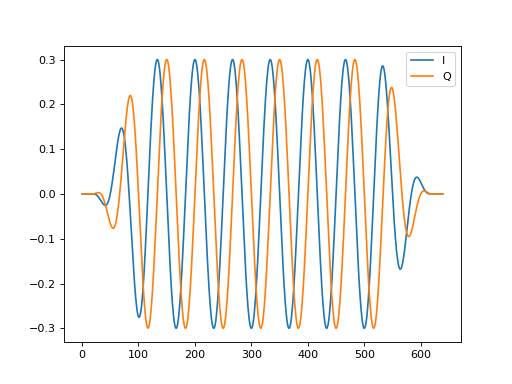
获取 Element 长度
import matplotlib.pyplot as plt

from bosing import Channel, Hann, Play, Stack, generate_waveforms

sample_rate = 2e9
schedule = Stack(
    Play(
        channel_id="xy",
        shape_id="hann",
        amplitude=0.3,
        width=100e-9,
        plateau=200e-9,
    ),
    margin=10e-9,
)
channels = {"xy": Channel(30e6, sample_rate, int(sample_rate * schedule.measure()))}
shapes = {"hann": Hann()}
result = generate_waveforms(channels, shapes, schedule)
w = result["xy"]
plt.plot(w[0], label="I")
plt.plot(w[1], label="Q")
plt.legend()
(Source code, png, hires.png, pdf)
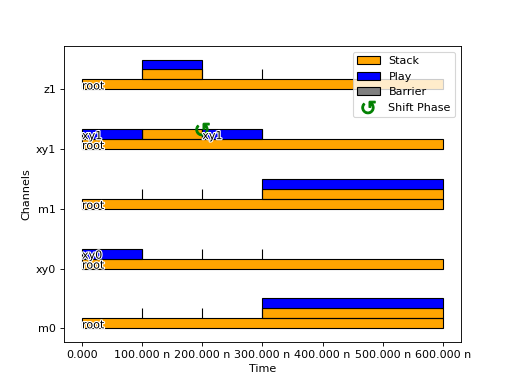
画图展示编排结果
import matplotlib.pyplot as plt

from bosing import Barrier, Play, ShiftPhase, Stack

xy = [Play(f"xy{i}", "hann", 1.0, 100e-9, label=f"xy{i}") for i in range(2)]
z = [
    Stack(Play(f"z{i}", "hann", 1.0, 100e-9), ShiftPhase(f"xy{i}", 1.0))
    for i in range(2)
]
m = Stack(*(Play(f"m{i}", "hann", 1.0, 100e-9, plateau=200e-9) for i in range(2)))
b = Barrier()

schedule = Stack(xy[0], xy[1], b, z[1], b, xy[1], b, m, label="root")

schedule.plot()
plt.show()
(Source code, png, hires.png, pdf)

生成包络与指令
from bosing import (
    Barrier,
    Channel,
    Hann,
    Play,
    Stack,
    generate_envelopes_and_instructions,
)


def main() -> None:
    length = 1000
    channels = {"xy": Channel(30e6, 2e9, length)}
    shapes = {"hann": Hann()}
    schedule = Stack(duration=500e-9).with_children(
        Play(
            channel_id="xy",
            shape_id="hann",
            amplitude=0.3,
            width=100e-9,
            plateau=200e-9,
        ),
        Barrier(duration=10e-9),
    )

    envelopes, instructions = generate_envelopes_and_instructions(
        channels, shapes, schedule
    )

    inst0 = instructions["xy"][0]
    env0 = envelopes[inst0.env_id]

    print("env dtype:", env0.dtype)
    print("env length:", env0.shape[0])
    print(
        "inst:",
        {
            "i_start": inst0.i_start,
            "env_id": inst0.env_id,
            "amplitude": inst0.amplitude,
            "freq": inst0.freq,
            "phase": inst0.phase,
        },
    )


if __name__ == "__main__":
    main()